AEDA (Advanced Electromagnetic Detection Application) is a spectrum monitoring platform that will lay the groundwork for a dynamic spectrum sharing system in the future. By building out a network of low cost spectrum sensors that is high in both density and reach, better RF sensing, detection, and avoidance algorithms can be developed and tested based on real world data.

AEDA Live
AEDA Live is our browser-based implementation of AEDA, and can be found at /live. We will soon integrate all AEDA features here, but at the moment, static nodes (hosted on a Pi) are separately available through /dashboard. TDOA is currently limited to static nodes, while live nodes are used for wideband scans and RF drive tests.
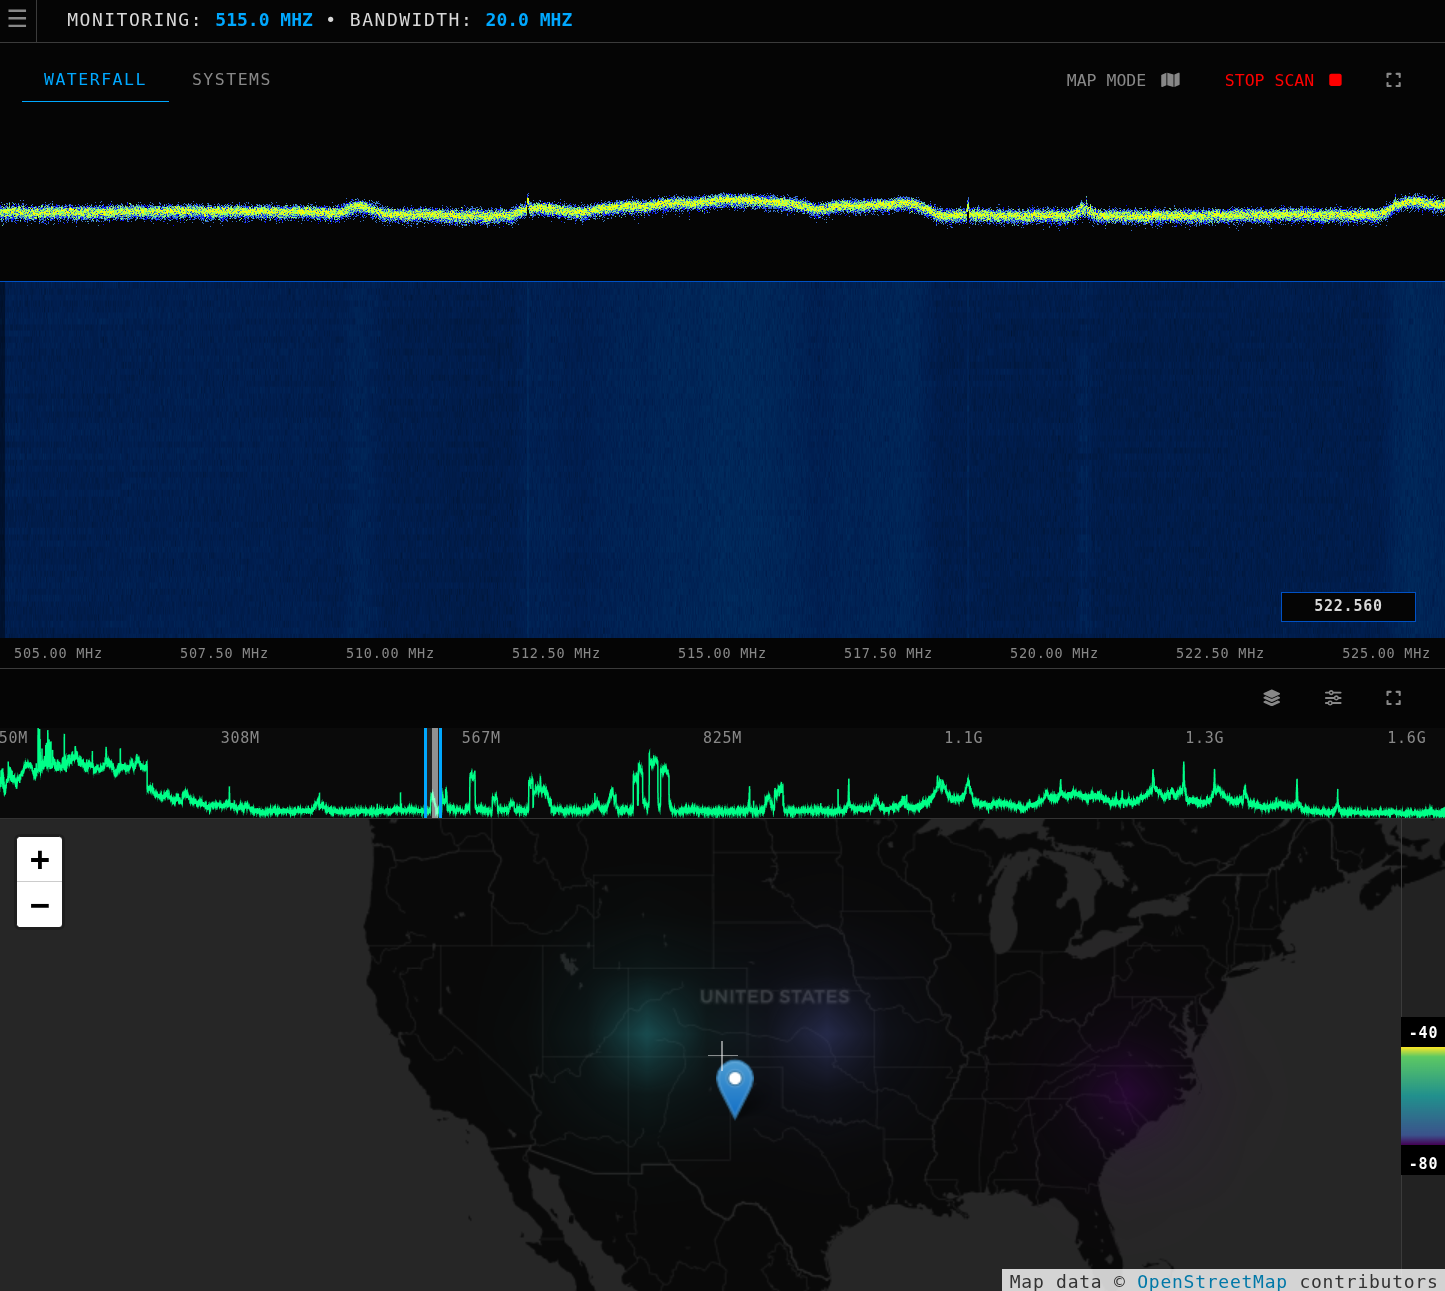
To start a scan, plug in an RTL-SDR (v3) into your device, and log into AEDA Live with a Chromium-based browser (Chrome, Chromium, or Brave). Click "Start Scan" and allow access to the RTL-SDR. Since we use a WebUSB implementation of librtlsdr, no downloads are required; AEDA runs right in your browser!
Your bandwidth and center frequency are displayed at the top of the screen, and can be adjusted on with the scan selector on the map FFT. Click to change the center frequency, and click and drag an edge to change your bandwidth.
Current Features
AEDA currently supports wideband scans and TDoA radiolocation with RTL-SDR's.
How to configure AEDA
The first step to using AEDA is getting your radio hosted. Go to github and download the node script, and follow the instructions in the README to set it up. Once everything is installed, you should be able to navigate to the node's config site and see a spot to enter an API key.
Next, go to the AEDA Dashboard and log in. If you need to transfer an old account, contact us and we'll handle the transfer for you.
Then, head over to your account page and create a new node. Copy the API key and paste it into the node's config site. Re-start the node script, and your SDR node should now be authenticated with AEDA.

You should now see the node show up on the map on the main page.

Running Scans
Before you start a scan, go to Settings > Scan Settings and configure what bandwidth and frequency you want to look at. To start a scan, simple click on the node pins you want to add, click "Start Scan", and select which node you want to tune to.

To capture a spectrogram image, first click on the waterfall to select the center frequency of the signal that you want to capture. Then, adjust the trigger window, and click "Activate Trigger". When a signal is detected in the trigger window, your SDR will automatically capture a 1 second spectrogram and send it to AEDA. You can then view this image under the Spectrograms tab.
Modulation detection for WBFM, NBFM, DMR, and P25 is available now. Simply click "Detect Modulation" after capturing a spectrogram image. We're constantly improving our models; let us know your results and email is if there's new modulation types you'd like to see!

To save your waterfall image and average power levels, simply click "Capture". AEDA will export the waterfall image and waterfall data to a .zip file and download it.

Note: we're still finalizing a few small bugs with node <-> client assignments, if the scan doesn't start, either try to start it again, refresh the page, or contact us and provide the node and client console logs.
TDoA Explanation and Theory
TDoA stands for Time Difference of Arrival. Imagine a room with two microphones in it, and a person clapping in the middle of the room. If we look at the signals from both microphones (assuming they're synchronized), we can see which microphone the clap hit first, and how long it took to get to the next microphone. Since we know the speed of sound, this is equivalent to saying "someone is clapping N feet closer to microphone A than microphone B."

The two keys parts to TDoA are synchronization of receivers, and receiver geometry. Syncronization between receivers is required as without that, you have no way to relate the received signals together*. In most commercial TDoA systems (or even ones like the Kiwi SDR), synchronization is done through a GPS clock. This is extremely accurate, but requires dedicated hardware. In our system, we use a reference transmitter with a known location as the synchronization signal. This is technically called D-TDoA (with D for differential), but no one cares.
Since a we're plotting the potential transmitter locations between a pair of nodes with each hyperbola, the location of the transmitter relative to those nodes will have a great effect on accuracy. This is called Dilution of Precision, and is why TDoA requires good receiver geometry. When choosing a location to set up your SDR's, this is important to take into account.

We won't get into the math here, but we would highly recommend checking out the implementation by Panoradio-SDR, as well as looking under "TDoA" on the rtl-sdr blog. Our system is uses a very similar method to theirs, and was an incredible resource as we were developing this.
The key thing to understand is the effect that the type of signal has on the correlation. Narrowband, continuous signals (like FM radio during silence, or even when certain instruments are playing) have a poor correlation function: that is, when we slide the signals over each other to see how similar they are, the peak of the correlation is rounded. On the other hand, wideband and noise-like signals (TV stations, cellular towers, and other digital modulation schemes) have a very sharp correlation function. That is, we can line up the signals very accurately in time.
The last key thing to understand is the method of correlation. We currently use correlation of phase difference for our system, because of the lack of sensitivity to frequency offsets between receivers. While this makes the SDR side easier to implement, this does mean that correlation will only work on frequency or phase modulated signals (no AM signals). This isn't an issue in practice as most modern signals use some sort of angular modulation.
Summary:
- We should choose a reference transmitter with a known location, and a powerful, wideband signal
- The better the correlation properties of our target signal, the more accurate the correlation will be
- We currently don't support AM signals
TDoA
Note: You need 3 SDR nodes to preform TDoA. 3 nodes per user is the current maximum that we support.
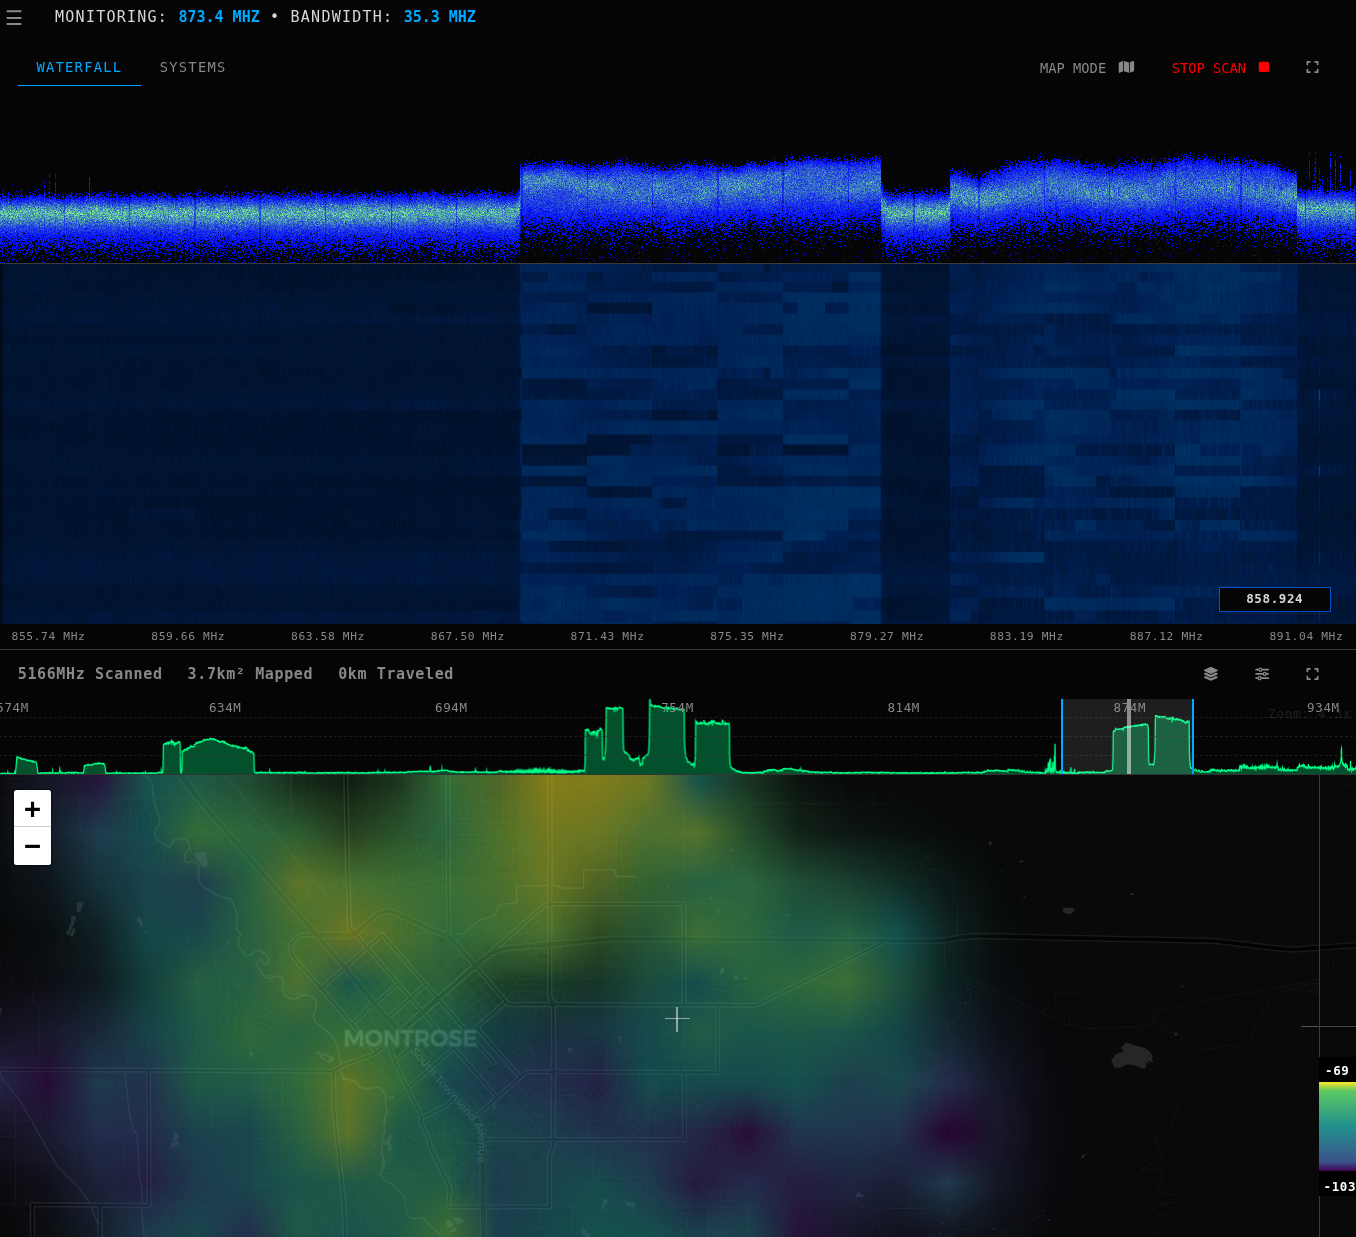
The first step for TDoA is finding a suitable reference signal, which can initially take some time. Luckily, the wideband scanning features make this a lot easier. Start a wideband scan with 100 or so MHz of bandwidth starting in the 400MHz range. Then, try to find some active wideband signals, and pick one that all 3 of your nodes can pick up well (you can switch between nodes by clicking on them in the sidebar). We usually use DVB-TV signals at around 500 MHz for our reference.
To locate the position of a reference transmitter, you can use one of the many FCC databases that corresponds to your signal frequency. If you're not sure where to start looking, you can always ask Grok, ChatGPT, or Claude. The two main databases that you should look in are ULS and LMS
One thing to note is that DVB signals are often SFN's, or single frequency networks. This can make it almost impossible to get an accurate correlation, though this can sometimes be mitigated by working through several frequencies within their bandwidth (i.e. if the signal is from 554 - 560 MHz, tuning to 555MHz might be the only frequency that works for your node locations).
Once you've located the position of a few transmitters, it's time to test them to see which have good correlation properties. The easiest way to do this is to set both your target and reference frequencies to the frequency you want to set as your reference. I.e. you're preforming TDoA on a signal that you know the location of.
Filter settings are the filter width that's applied to your target signal. "None" is good for wideband signals that take up the entire 2.4MHz of the RTL's bandwidth, 200k for FM, 13k for narrowband signals.
Note: We currently recommend setting "Samples" to 1.5. We have not yet implemented resampling in our TDOA processing, which means that as the sample rate of your 3 SDR's drift, the peak of the correlation can jump one sample. We are currently fixing this, and adding coarse NTP synchronization to support lower sample numbers.

Once you type in your reference location, a pin should pop up on the map labeled Reference Transmitter. Click Start TDOA and wait for the scan to complete and the hyperbolas to be plotted. You should see all of them intersecting at or near the reference transmitter.

Once this is working, you can start testing TDoA by trying to locate FM stations. Because of the poor correlation function of FM signals, and the fact that the quality varies over time, you might have to take a few correlations to get a rough idea of where the signal is. We recommend using 1.5-1.8 million samples for each scan. To quickly change TDoA target frequencies, you can simply click on the waterfall.
In order to deal with poor short-time correlation, we average the correlation results over the duration of the TDoA scan. The dimmer hyperbolas are for each of the individual sample windows, and can give you an idea as to how accurate the correlation result was. The bright hyperbolas are the averaged result.

5 separate TDoA scans layered on top of each other
We're rapidly working on improving our TDoA algorithms, and adding more configurable settings like signal detection triggering. As with any radiolocation system, TDoA accuracy will always be limited by the properties of the received signal, but can be improved with clever signal processing.
Note: It's often better to get a rough idea of your target frequency by clicking the waterfall, then tuning it manually under Settings > TDOA Settings.

Congratulations!
You now have a functioning radiolocation system for ~$100 in SDR's. If you are having problems locating signals, please reach out to us. We're still improving our DSP process for different types of signals, and your feedback would be greatly appreciated to help make AEDA better.
Future Plans and Features
The basic premise of AEDA is simple: anyone can buy and host an off-the-shelf SDR. With that, you get access to direction finding, wideband scanning, and signal classification tools. Additionally, your SDR node will be able to be rented out to preform band studies, radiolocation, or interference detection. A percentage of this revenue gets sent back to you as a node host.
As the network grows, we aim to develop more advanced RF mapping and localization software, and build a high resolution map of RF occupancy all throughout the US.
We're currently focused on improving RF monitoring capabilities for anyone hosting a node. The initial public release will help us grow the network and preform some minor bug fixes and improvements. During this time, access to your SDR node will be limited to you. We will occasionally be preforming background wideband scans to test our RF modeling and mapping tools. Background scans will be low-priority and interruptable and will focus on LMR, LTE, and ISM bands.
When SDR access becomes public, we will provide a way for you to accept payments for node rental time. In your account page, you will also be able to see all ongoing and previous scans, as well as block out access to frequency ranges of your choosing. Wideband scans only gather spectral density data, no IQ information.
We're currently making sure that our server can handle all the necessary traffic, and ironing out some minor bugs. If you find one, please contact us!
We'll be posting more updates on spectrum sensing capabilities and commercial use cases here later, so make sure to check in.
If you have any feature requests, please let us know!